
Overview:
'Anxiety and COVID' is an infographic poster developed to educate the general public on CDC health statistics on the correlation of anxiety trends during the COVID-19 pandemic. Giving a visual way to comprehend otherwise obscure data.
Audience:
General Public, Medical/Healthcare settings.
Tools Used:
Illustrator, Excel
Accomplishments:
- Develop a clear infographic visualizing CDC COVID statistics
-Analyzed and processed data based on current, as-released information.
- Worked within clear design parameters while illustrating in visual cohesion.
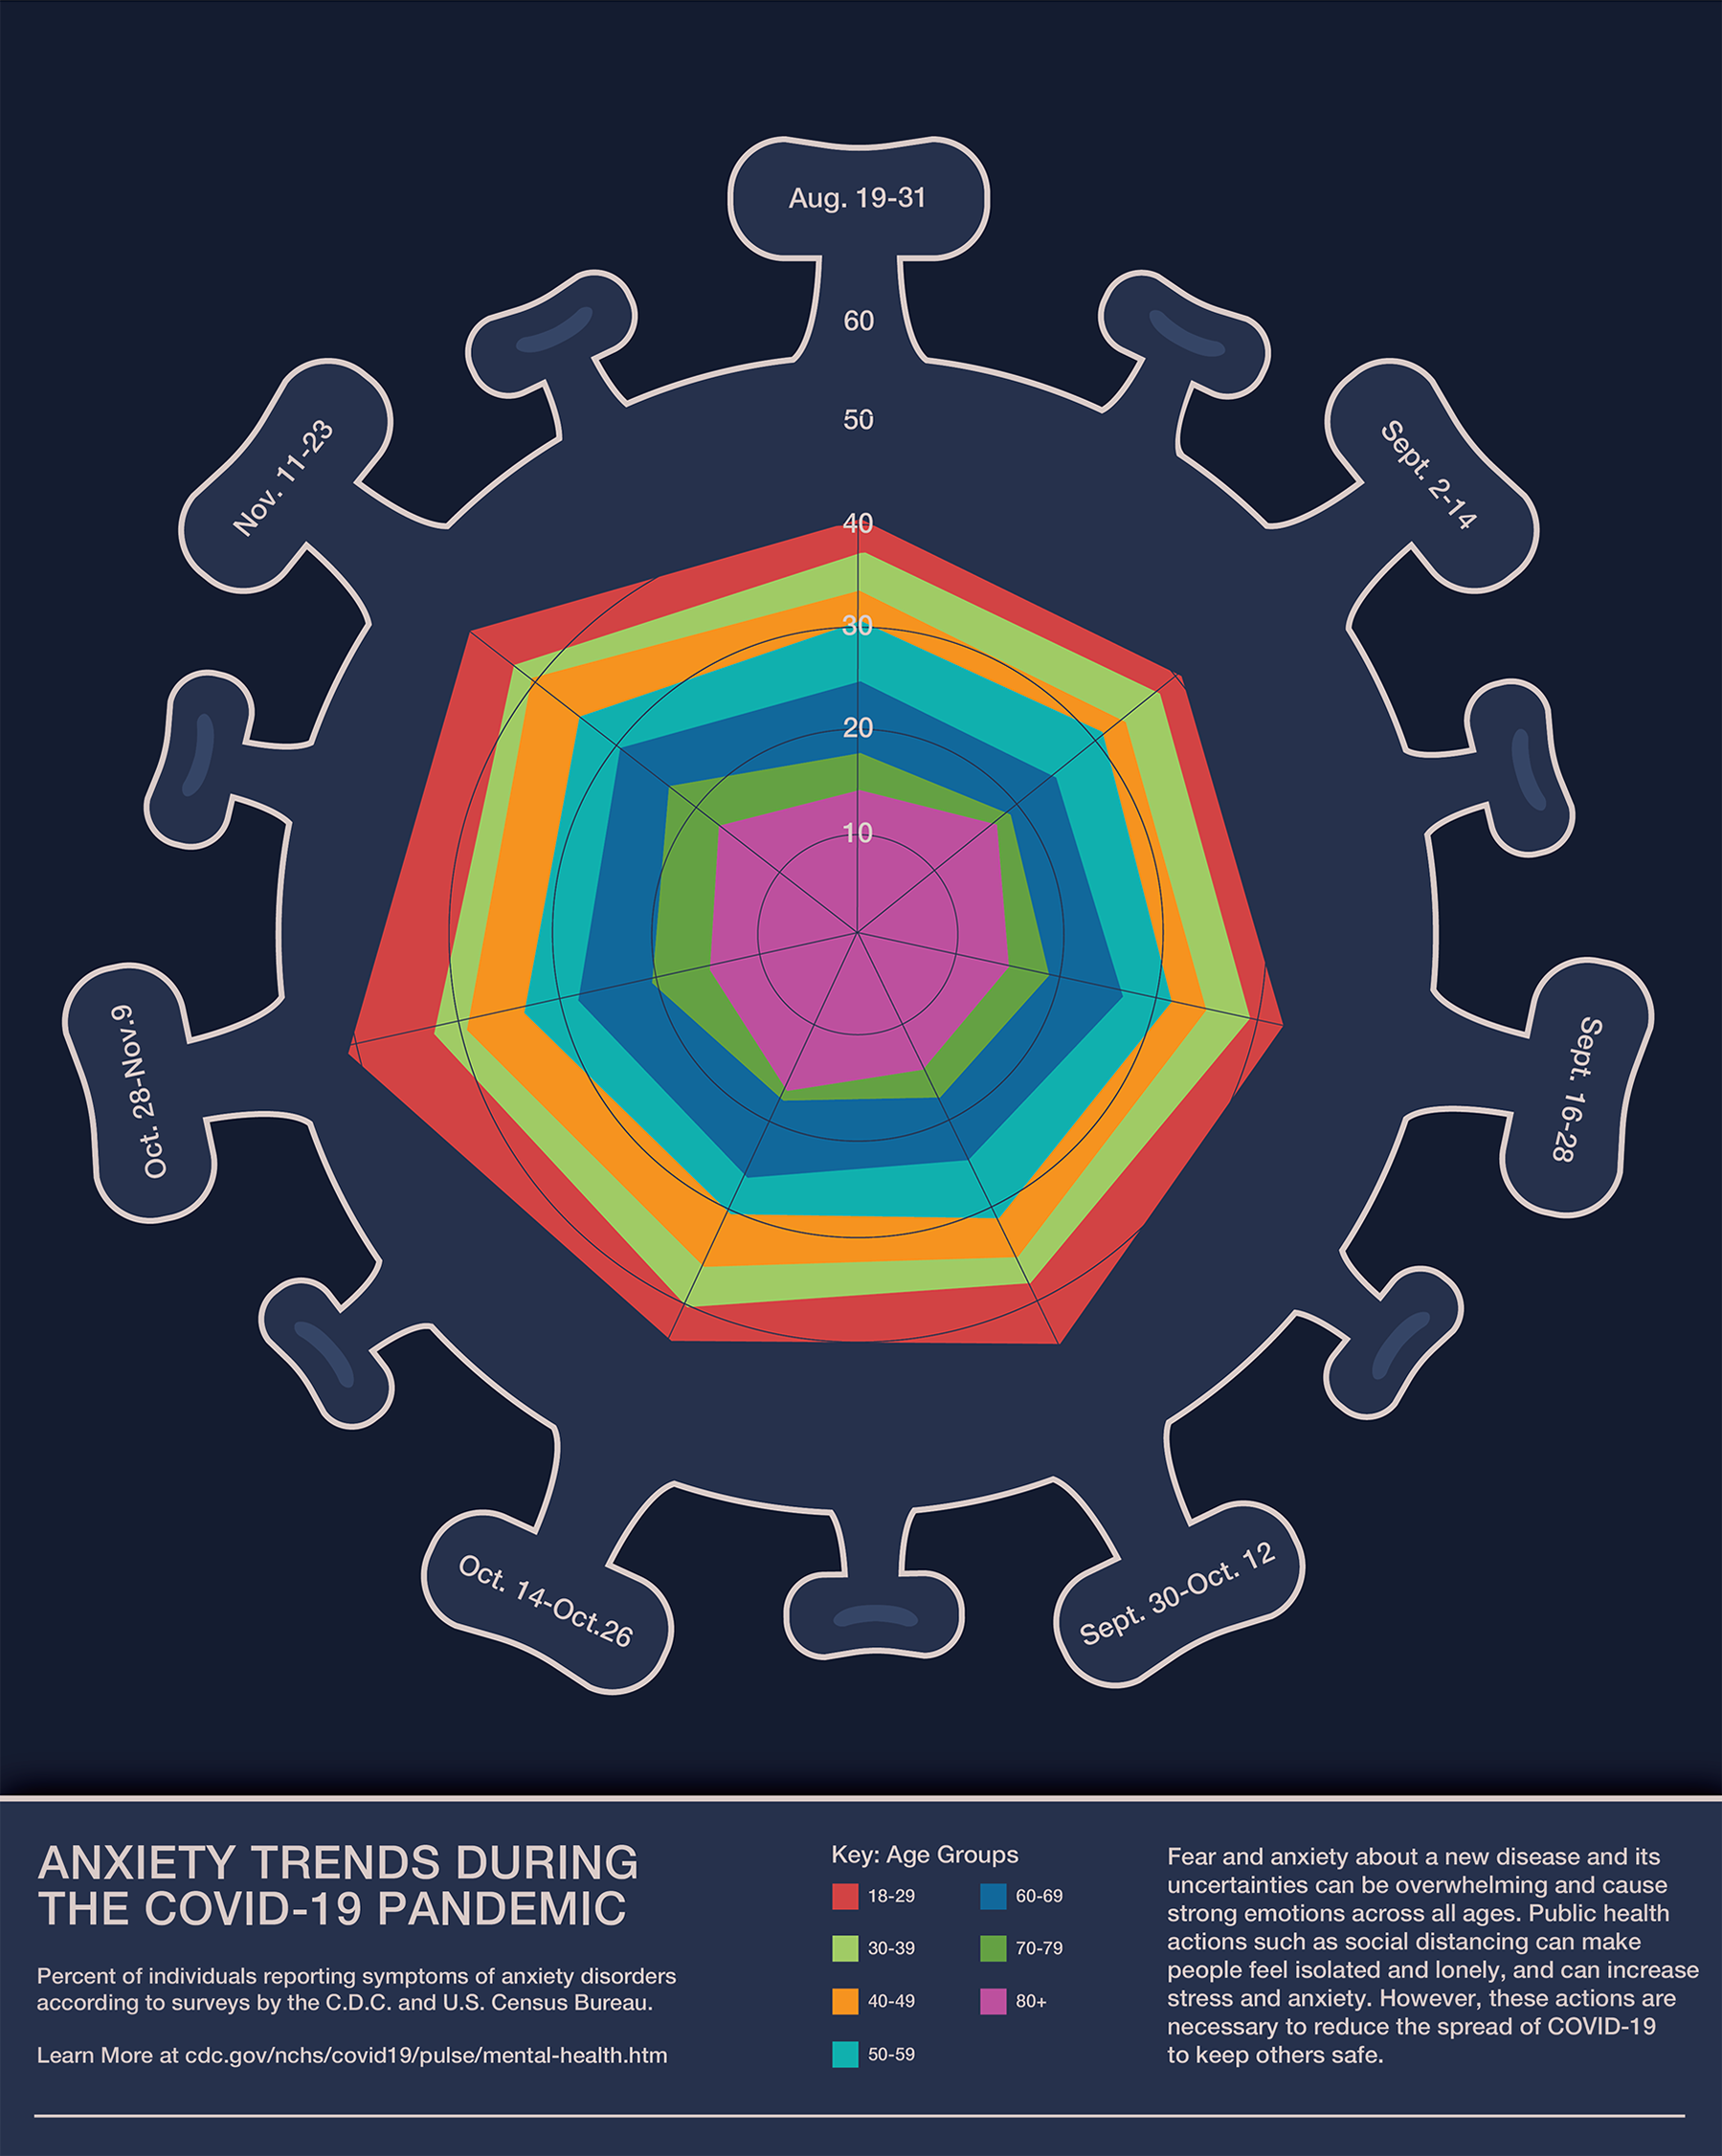
In the midst of pandemic, and highlighted by my own experiences this infographic illustrates the rise of personal anxiety during the COVID-19 pandemic. Compiling new data from the C.D.C. and U.S. Census Bureau, I developed a radial graph to illustrate the dynamic nature of the data, while also allowing for synergy with its illustrative side. The centrally focused virus houses the graph almost as part of its internal makeup - part of its sickness. Yet as a whole, the data remains presented in a professional and serious matter. The dark color scheme of the exterior helps add to the anxious feeling, while the colorful data-points inside the ‘COVID’ bubble appear sporadically. These themes tie directly into the data being described while also maintaining a central visual point for the viewer.